
Valuations of Asian equities hit a 16-month low at the end of September, as concerns over an economic slowdown in China and growing expectations of monetary policy tightening by major central banks dragged down equity markets.
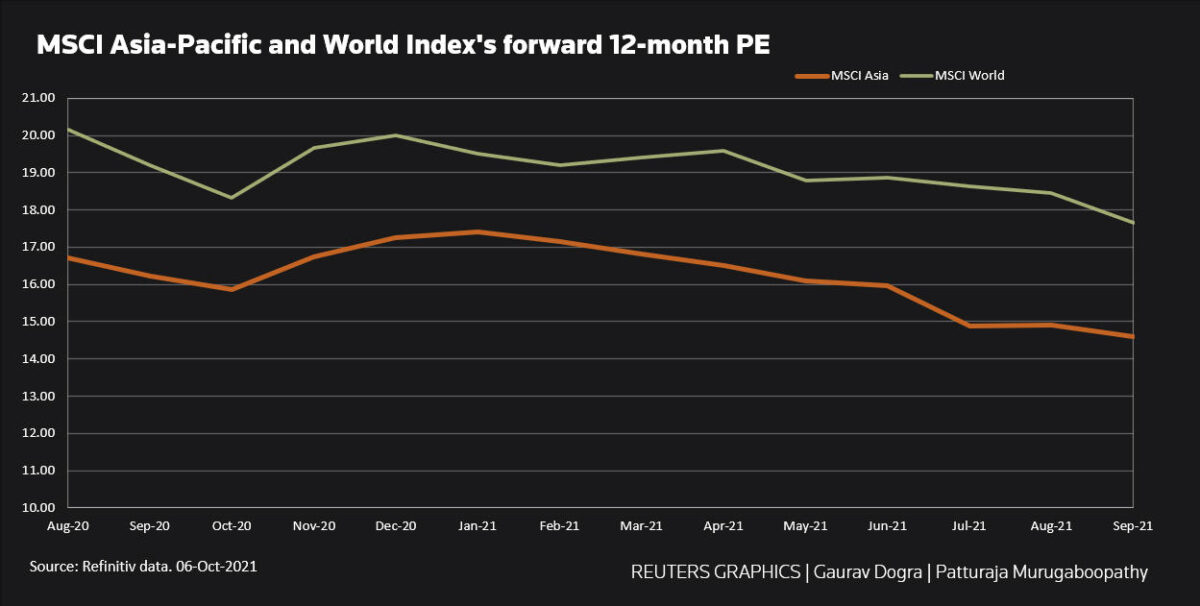
The MSCI Asia-Pacific index fell 2.3 percent last month and its forward 12-month P/E ratio was 14.6 at the end of September, the lowest since May 2020, according to Refinitiv data.
Graphic: MSCI Asia-Pacific and World index’s PE:
Graphic: Valuation of Asia-Pacific equities:
So far this year, the MSCI Asia-Pacific index has lost 3.2 percent, compared with the MSCI World’s 10.3 percent gain. “Asian equities have been under acute pressure this year due to growth deceleration in China, regulatory overhang on technology stocks, and the credit issue with Evergrande,” said Suresh Tantia, a senior investment strategist at Credit Suisse. “On top of this, as growth momentum has been weak, earnings revisions are normalising.”
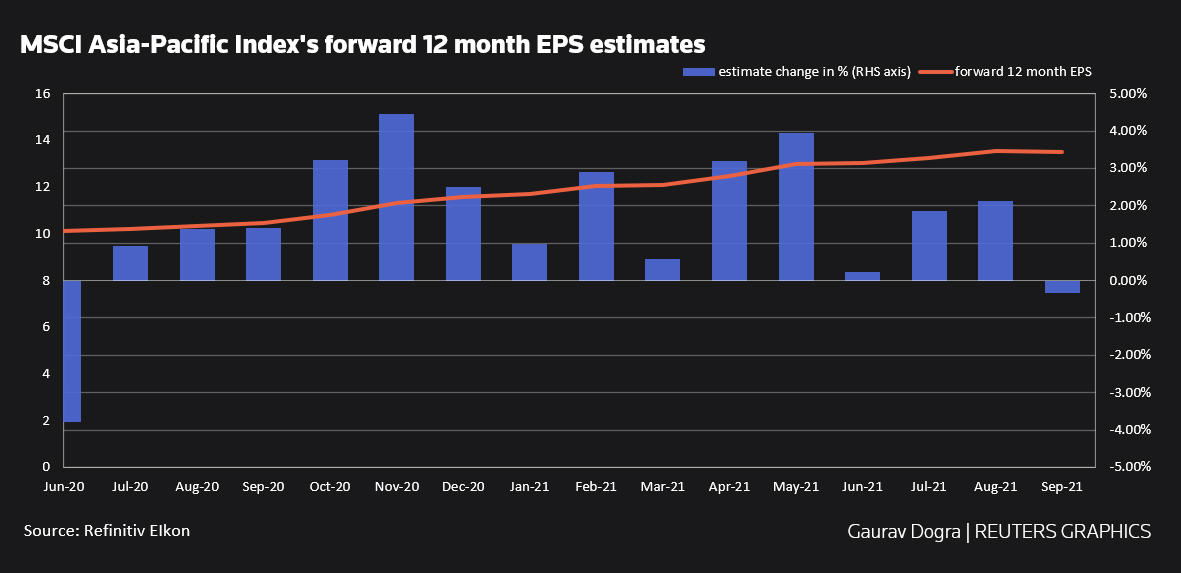
Analysts downgraded the forward 12-month P/E ratio for Asian companies by 0.3 percent last month, the first cut since June 2020, as manufacturing contracted.
Graphic: MSCI Asia-Pacific index’s estimates change:
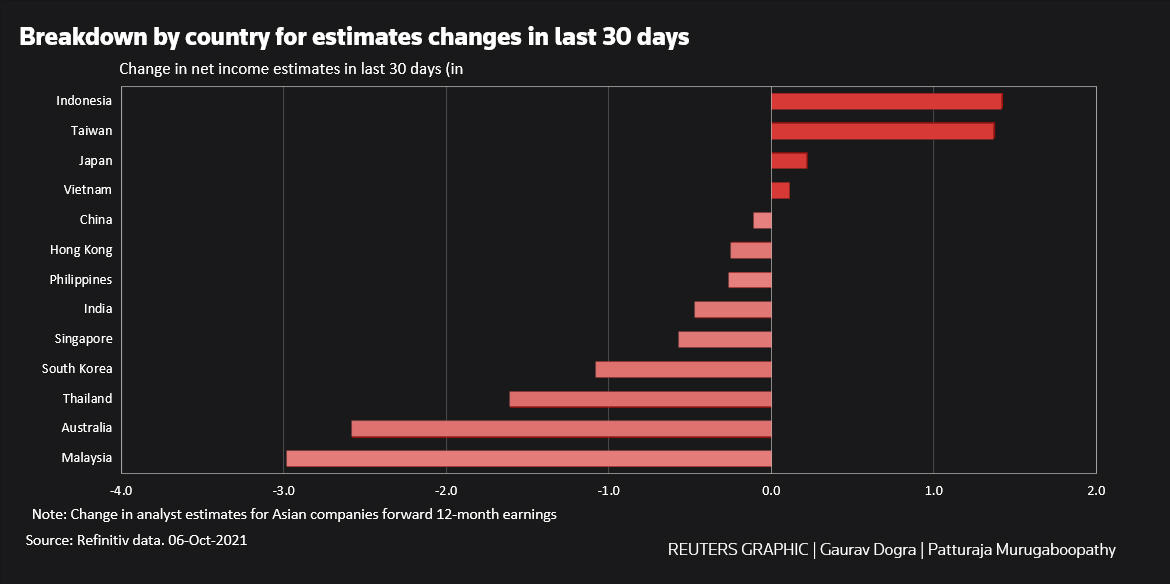
Malaysian and Australian companies saw the biggest earnings downgrade of more than 2.5 percent each. China saw a 0.3 percent cut in forward earnings.
With liabilities of $305 billion, China Evergrande Group has sparked concerns that its cash crunch could spread through China’s financial system and reverberate globally. China’s official manufacturing Purchasing Manager’s Index (PMI) fell to 49.6 in September versus 50.1 in August. A reading below 50 indicates a contraction.
However, Andrew Gillan, head of Asia ex Japan equities at Janus Henderson Investors, said Asian equities look relatively attractive compared to developed equities after the third-quarter weakness.
“Outside of China, we are seeing stronger performance from markets that are late to recover from COVID-19 and it is reasonable to make a case for that to continue in India and parts of South East Asia.”
Graphic: Breakdown by country for estimates changes in last 30 days:
Graphic: Breakdown by sector for estimates change in last 30 days:
By Gaurav Dogra

